Introduction: The F&B Scaling Wall
You have one restaurant. It’s profitable. You’re making good money. Life is good.
Then you open location 2. It works, but doesn’t feel as profitable as location 1. You’re not sure why.
Then you attempt location 3. Now you’re overwhelmed. You don’t know which location is profitable. Your costs are spiraling. You’re working 70+ hours/week but somehow making less money than when you had one restaurant.
You’ve hit the F&B scaling wall.
According to Restaurant Business Magazine’s 2025 Industry Survey, 87% of independent restaurant operators stop expanding at 3 locations. Not because demand isn’t there, but because financial complexity exceeds their ability to manage it.
The reasons?
- Inconsistent profitability across locations (you don’t know why)
- Hidden cost structure differences (each location operates differently)
- Inability to replicate success (what worked at location 1 doesn’t automatically work at location 2)
- Cash flow unpredictability (you can’t forecast accurately with inconsistent operations)
- Burnout from manual management (no systems, every day is firefighting)
In this guide, we’ll explore the specific financial management challenges F&B multi-unit operators face, why these challenges prevent scaling, and how proper financial visibility transforms F&B from plateauing at 3 locations to confidently scaling to 10+.
Why F&B Businesses Plateau at 3 Locations
Challenge 1: Identical Locations, Different Economics
Here’s the paradox: You replicate the same concept, same menu, same format at location 2.
But the economics are completely different:
- Location 1 rent: $5,000/month | Location 2 rent: $8,000/month
- Location 1 labor: 18% of revenue | Location 2 labor: 24% of revenue
- Location 1 food cost: 28% | Location 2 food cost: 31%
- Location 1 covers/shift: 45 | Location 2 covers/shift: 32
Net result: Location 2 is 8-12% less profitable despite being identical concept.
Without visibility into this, you assume location 2 is just “different” or “the manager isn’t as good.” You don’t see that rent difference alone explains 60% of the margin gap.
Result: You can’t replicate success, location 2 underperforms, you get discouraged about expansion.
Challenge 2: The Hidden Cost Structure
F&B has complex cost structures:
- Food cost (COGS varies by menu mix)
- Labor (covers, shift timing, manager skills)
- Rent & utilities (location dependent)
- Delivery fees (online-only costs)
- Credit card fees (payment mix dependent)
- Waste & theft (location dependent)
The spreadsheet problem: You see “food cost went up” but don’t know if it’s:
- Menu mix shift (more expensive items selling)
- Supplier price increase
- Portion control problem
- Waste/theft
- or a combination
Without granular visibility, you can’t accurately forecast cash flow across locations or fix cost problems. You just know things are getting worse.
Challenge 3: Inability to Compare and Learn
If you have 2-3 locations, you should be able to compare operational metrics:
- Labor efficiency (revenue per labor hour)
- Food cost %
- Cover count and average check
- Prime time vs. off-peak
- Manager performance
But you can’t, because:
- Each location records data differently
- Labor tracking varies (some use timesheets, some don’t)
- Food cost calculated inconsistently
- No standardized reporting
Result: You’re flying blind. Great learning opportunities from comparing locations go unnoticed.
Challenge 4: Cash Flow Unpredictability
With one restaurant, you know cash flow patterns:
- Peak seasons, slow periods
- When vendors need to be paid
- When you personally take money out
With 3 locations:
- Each location has different seasonality patterns
- Vendor payments are staggered, harder to track
- You don’t know true consolidated cash position
- Forecasting becomes impossible
Real consequence: A restaurant operator with 3 units didn’t realize location 3’s cash position was dire until month-end. By then, they were late paying suppliers. Had to use emergency credit line, costing $3,000 in fees.
Challenge 5: Burnout from Manual Management
Managing 3 restaurants means:
- Manually tracking each location’s financials
- Consolidating data at month-end
- Trying to understand problems after the fact
- Acting as part-time accountant instead of operator
Most F&B operators can’t maintain this. By month 3 of location 3, they’re exhausted and stop tracking diligently. Financial management falls apart.
The F&B Visibility Gap: What You Should Know But Don’t
What You Want to Know
Daily:
- Revenue by location and meal period
- Covers and average check by location
- Food cost % trending by location
- Cash position by location
Weekly:
- Location profitability
- Labor efficiency (revenue per labor hour) by location
- Any anomalies needing attention
Monthly:
- Detailed P&L by location
- Performance vs. budget & prior year
- Actionable insights on underperformance areas
What You Actually Know
Monthly (if your bookkeeper gets it done):
- Approximate profitability (accounting usually behind)
- Vague sense of how each location is doing
- Surprises (unexpected costs, cash position worse than expected)
The gap is enormous. You’re making decisions 3-4 weeks behind reality with incomplete information.
How Multi-Unit F&B Operators Scale Past 3 Locations
The Key: Financial Transparency + Operational Consistency
Successful multi-unit F&B operators share characteristics:
1. Real-Time Financial Visibility
- POS data from all locations consolidated daily
- Know profitability by location within 24 hours (not month-end)
- Understand cost drivers (food %, labor %, etc.)
- Spot problems before they cascade
2. Standardized Operational Metrics
- Each location tracks same metrics same way
- Can compare locations meaningfully
- Identify best practices (why is location 1’s labor % 18% and location 2’s is 24%?)
- Replicate success systematically
3. Predictable Cash Flow Management
- Know exactly how much cash each location generates
- Forecast consolidated cash position
- Plan payables and working capital
- Make confident expansion decisions
4. Empowered Local Management
- Managers see their location’s metrics in real-time
- Understand what drives profitability
- Have clear targets and accountability
- Competition between units drives improvement
5. Data-Backed Expansion Decisions
- Before opening location 4, analyze:
- What worked at locations 1-3
- What will be different (rent, labor market, demographics)
- Financial requirements to be profitable
- Timeline to profitability
- Instead of hoping location 4 works, you know it will
Real-World Case Study: From 3-Location Plateau to 8-Location Growth
The Business: Independent casual F&B operator, 3 locations, $6M revenue, $300K profit
Starting Situation:
- Manual consolidation of financial data took 2-3 days monthly
- Couldn’t compare locations meaningfully
- Each location operated independently (no learning)
- Attempted location 4 opening but pulled back after 6 months (couldn’t manage complexity)
- Owner was burned out, considering exit
The Transformation:
- Implemented restaurant-specific financial management system
- Connected POS from all 3 locations, accounting, payroll
- Built location-level profitability dashboards
- Standardized operational metrics across locations
Critical Insights (First 60 Days):
- Location Economics Reality:
- Location 1: 32% margin (mature location, established)
- Location 2: 18% margin (newer location, learning curve)
- Location 3: 22% margin (solid performer)
- Understanding margin differences allowed owner to identify specific issues at Location 2
- Labor Efficiency Gap:
- Location 1: $8.50 revenue per labor hour
- Location 2: $6.20 revenue per labor hour
- Location 3: $7.80 revenue per labor hour
- Root cause identified: Location 2 manager was great at hospitality but inefficient at labor scheduling. After coaching and process changes, improved to $7.50/hour.
- Food Cost Variations:
- Location 1: 26% food cost (optimized menu, strong suppliers)
- Location 2: 29% food cost (newer supplier relationships, menu not optimized)
- Location 3: 27% food cost
- Action: Moved Location 2 to Location 1’s suppliers, saved 2% on food cost alone.
- Cash Flow Clarity:
- Could now forecast consolidated cash position 12 weeks ahead
- Knew payables timing and could negotiate terms strategically
- Prevented emergency cash shortfalls
Implementation of Changes (Months 2-4):
- Aligned Location 2’s operational practices with Location 1 (best practices)
- Standardized scheduling processes
- Aligned supplier relationships
- Monthly manager comparison meetings (location managers competing productively)
Results (6 months):
- Location 2 margin improved from 18% to 26%
- Location 3 optimized further to 24% margin
- Owner went from chaos to clarity in under 3 months
- Confidence to open Location 4 based on understanding what works
Financial Impact (Annual):
- Location 2 margin improvement: +$300K profit (annualized)
- Operating efficiency: +$80K
- Time saved: 40 hours/month (owner redirects to strategy, growth planning)
- Ability to confidently scale: Opened Location 4, Location 5 (planned Location 6 by year-end)
The F&B Financial Visibility Requirements
Essential Metrics for Multi-Unit F&B
Daily Metrics (Real-Time):
- Covers: By location, by shift (lunch/dinner)
- Average Check: By location
- Revenue: By location and shift
- Cash Position: By location
Weekly Metrics:
- Food Cost %: By location (cumulative for the week)
- Labor Cost %: By location
- Profitability: By location (preliminary)
Monthly Metrics:
- Detailed P&L: By location with variance analysis
- Margin %: By location
- Revenue per Location: Trend analysis
- Labor Efficiency: Revenue per labor hour by location
- Cost Driver Analysis: What moved margins
Why Real-Time Matters in F&B
F&B economics move quickly:
- A bad night is immediately visible (not days later)
- A supplier price increase affects margins immediately
- Seasonal swings happen fast (holiday periods, summer doldrums)
- Labor issues become apparent within days
Real-time visibility enables real-time corrections. Instead of waiting until month-end to discover a problem, you fix it the next day.
How to Scale F&B Past the 3-Location Ceiling
Step 1: Implement Financial Visibility (Month 1-2)
- Connect POS from all locations
- Connect accounting and payroll
- Build location-level P&L dashboards
- Standardize metrics across locations
Step 2: Identify Your Best Practices (Month 2-3)
Analyze which location(s) are most profitable and why:
- Operational practices (scheduling, inventory management, service style)
- Menu mix (what items are popular and profitable)
- Labor efficiency
- Supplier relationships
Step 3: Replicate and Improve (Month 3-4)
Share best practices across locations:
- Location 1’s scheduling process
- Location 3’s supplier relationships
- Location 2’s service model
- Create standardized playbook
Step 4: Empower Location Managers (Month 4-5)
- Share location profitability data with managers
- Set clear financial targets for each location
- Create accountability and friendly competition
- Give managers tools to improve
Step 5: Plan Expansion (Month 5-6)
With clean data and proven playbook:
- Understand your unit economics precisely
- Know what drives profitability
- Analyze new location viability
- Forecast profitability with confidence
- Scale deliberately instead of hoping
Comparison: Manual Management vs. Financial Visibility
| Aspect | Manual (Spreadsheets) | With Visibility System |
| Profitability Answer | “I think we’re okay?” | “Location 2 is 26%, Location 3 is 24%, trending up 2% YoY” |
| Food Cost Awareness | Know it’s ~28% overall | Know Location 1 is 26%, Location 2 is 28.5%, and why |
| Labor Efficiency | Guesswork | Know $7.80 revenue per labor hour, benchmarked |
| Cash Position | “Probably okay?” | Exact position, 12-week forecast |
| Problem Speed | Discovered at month-end | Discovered within 24 hours |
| Expansion Confidence | “Let’s hope it works” | “Based on our unit economics, Location 4 will be 24% margin” |
| Time Investment | 40-60 hrs/month | 5 hrs/month |
| Scalability | Breaks at 4-5 locations | Scales to 50+ locations |
The Business Impact: Why Visibility Enables Scaling
Without visibility:
- You’re overwhelmed at 3 locations
- Each location feels independent (no learning)
- Expansion feels risky (you don’t know what works)
- Growth stalls, burnout sets in
With visibility:
- You’re managing 3 locations with clarity
- Best practices transfer across locations
- Expansion is planned, not hoped for
- Growth accelerates, confidence builds
Real numbers: F&B operators with strong financial visibility grow from 3 to 8-10 locations over 3 years. Those without visibility stay at 3 and often shrink.
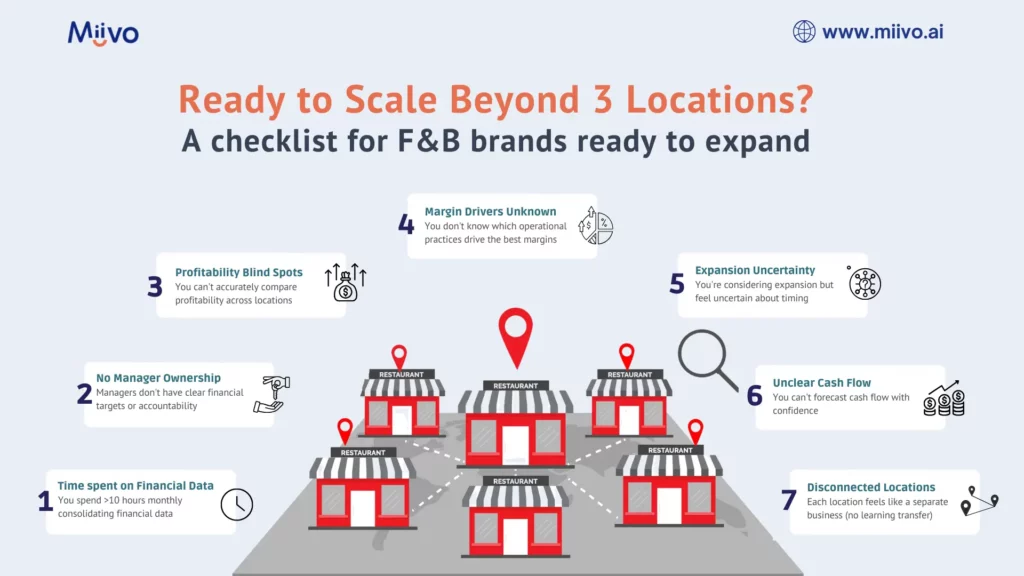
Checklist: Are You Ready to Scale Past 3 Locations?
☐ You spend >10 hours monthly consolidating financial data
☐ You can’t accurately compare profitability across locations
☐ You don’t know which operational practices drive the best margins
☐ You can’t forecast cash flow with confidence
☐ You’re considering expansion but feel uncertain about timing
☐ Each location feels like a separate business (no learning transfer)
☐ Managers don’t have clear financial targets or accountability
☐ You feel burned out managing multiple locations
Score 4+: You’re ready for a financial visibility system and will unlock significant growth.
Conclusion: Financial Visibility Is Your Scaling Enabler
The F&B scaling wall exists because most operators try to scale without financial visibility.
They open location 2, then location 3, and discover that without understanding their unit economics, they can’t replicate success or make confident expansion decisions.
The operators who scale past 3 locations and grow confidently to 8-10+ locations have one thing in common: they implement financial visibility systems that give them real-time insight into what drives profitability.
With this insight, they:
- Identify best practices and replicate them
- Correct problems before they cascade
- Forecast cash flow and plan expansion
- Empower managers through transparency
- Scale deliberately instead of chaotically
Restaurant-specific financial management tools exist precisely for this reason: to help F&B operators see what’s actually happening across their multi-unit operations so they can scale confidently.
The question isn’t whether financial visibility will help you scale. It absolutely will. The question is whether you’ll implement it before attempting your next expansion.