Introduction: The Multi-Location Nightmare
You own three retail stores. Each location has its own manager, POS system, and way of tracking expenses. Your accountant requests data from each location separately. You spend hours every week consolidating spreadsheets. By the time you have a complete financial picture, it’s already outdated.
Sound familiar?
Multi-location business owners face a unique challenge: financial visibility becomes exponentially harder as you expand. What worked with one location breaks down at three. What barely functioned at three becomes impossible at ten.
According to the Small Business Trends Report 2025, 72% of multi-location business owners report significant challenges in consolidating financial data across locations, leading to delayed insights, missed cost-saving opportunities, and inconsistent profitability metrics.
The good news? Modern technology can eliminate this chaos entirely.
In this guide, we’ll explore the real costs of financial data fragmentation, why consolidation matters, and how tools like Miivo help multi-location businesses achieve real-time financial visibility across all operations.
The Multi-Location Financial Data Crisis
Why Data Silos Destroy Profitability
When you operate multiple locations, each one generates financial data independently:
- POS systems record sales and transactions
- Accounting software tracks expenses, payroll, inventory
- Bank accounts show cash positions at each location
- Payment processors (Stripe, Square, PayPal) handle different payment methods
- Inventory systems may be completely separate or incompatible
Without a central system pulling all this data together, you face critical problems.
Problem 1: The Consolidation Tax (10-20 Hours/Month)
Your finance team spends countless hours manually pulling data from each location:
- Logging into multiple accounting systems
- Downloading reports from various platforms
- Copying data into master spreadsheets
- Reconciling discrepancies and fixing errors
- Recalculating metrics for the consolidated view
For a 3-location business with a part-time bookkeeper, this “consolidation tax” equals 10-15 hours monthly. At $50/hour, that’s $500-$750/month in pure overhead—time that could go toward strategic analysis instead.
For a 10-location business? You’re looking at 30-40 hours monthly, or $1,500-$2,000 in wasted labor costs.
Problem 2: Delayed Visibility = Missed Opportunities
Manual consolidation typically takes 7-10 days after month-end. By then:
- A location’s profitability crisis has already spiraled
- Cost overrun has gone unchecked for weeks
- Seasonal trend opportunity has passed
- A competitor’s pricing shift is already affecting your margins
McKinsey’s research on multi-unit retail operations found that businesses with real-time, location-level financial visibility made strategic adjustments 6-8 weeks faster than those relying on consolidated month-end reports.
This speed advantage compounds: a business that catches and corrects a location-level profitability issue in week 2 (vs. week 6) captures 4 weeks of margin recovery, potentially worth $5,000-$25,000 depending on location size and profit margins.
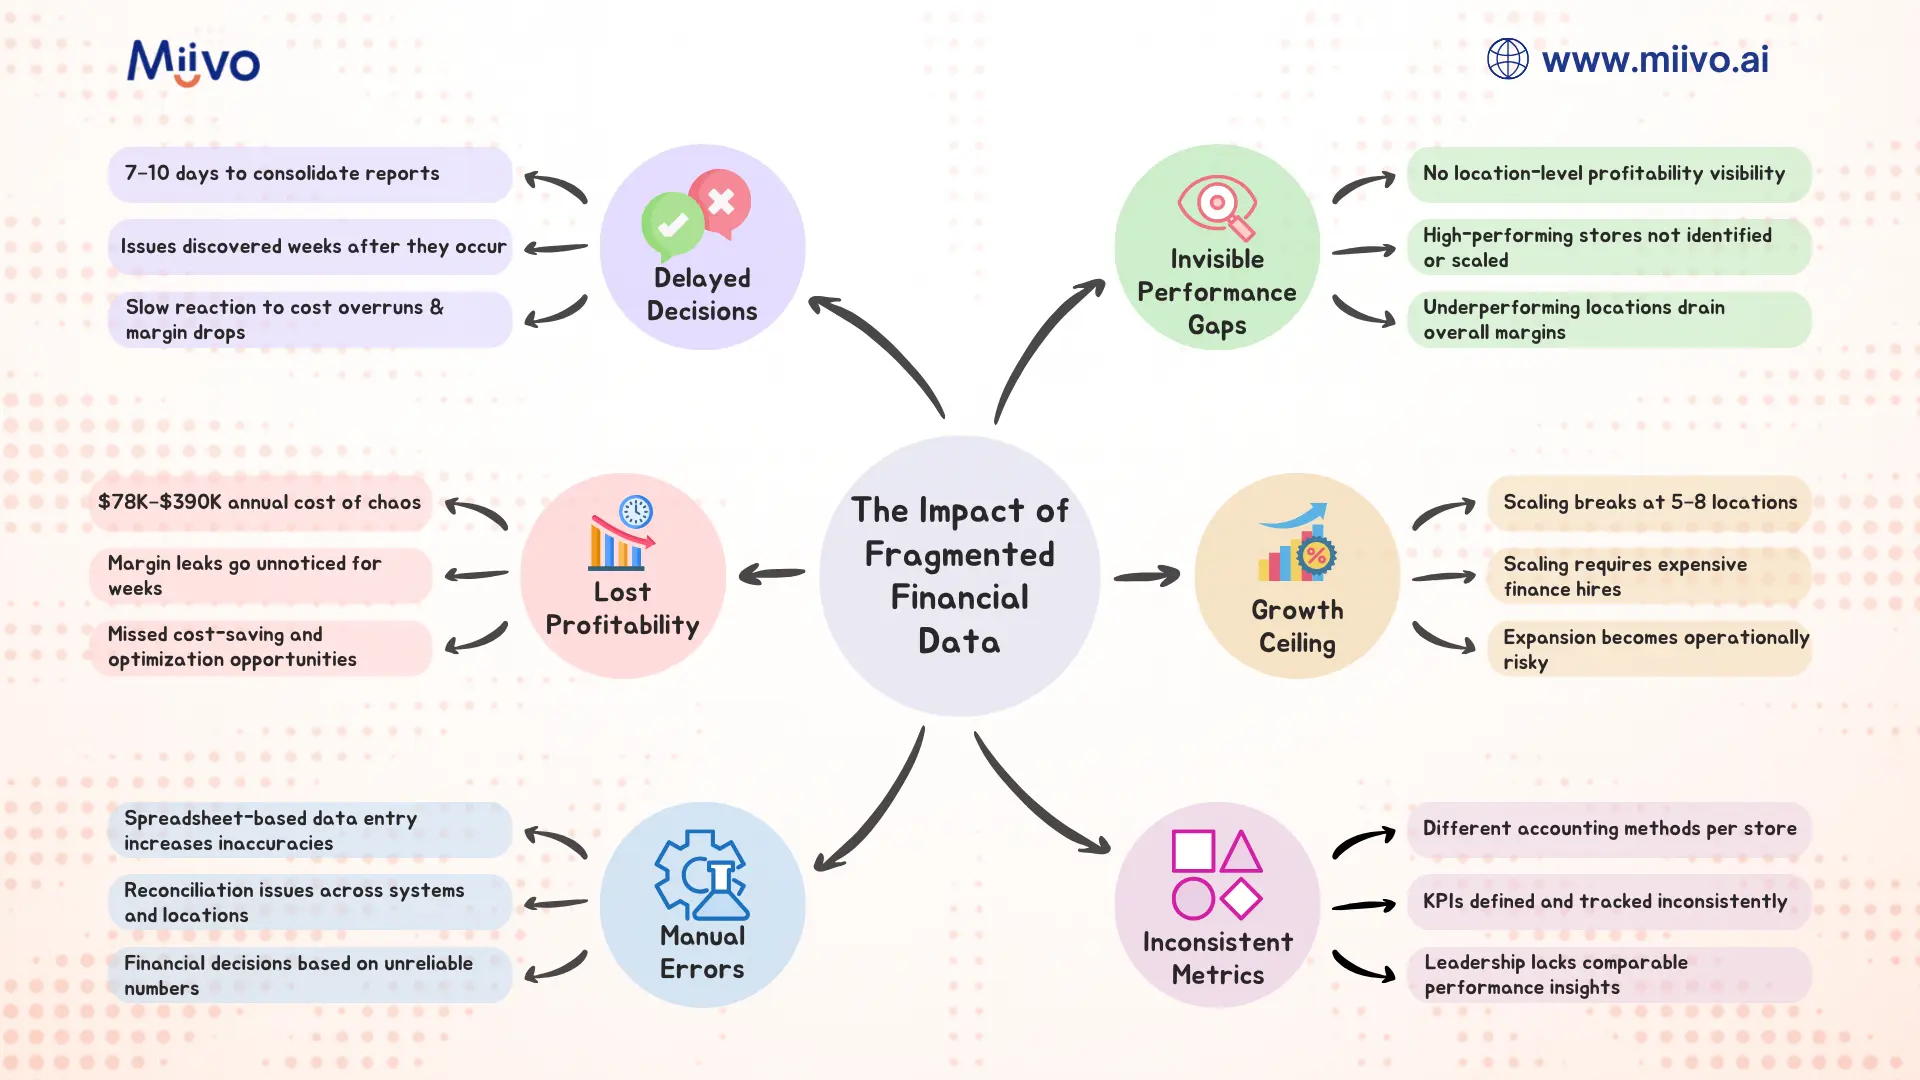
Problem 3: Invisible Profitability Gaps
Without location-level profitability analysis, you can’t see critical trends:
- Location A is highly profitable, Location B is barely breaking even, and you have no idea why
- Store 1 has 15% shrink, Store 2 has 3%, but you’re managing inventory system-wide
- Location 3’s customer acquisition cost is double the others, yet you’re using the same marketing budget allocation
- One location’s labor costs are 35% of revenue while another’s are 28%, and you haven’t noticed
These invisible gaps mean you’re likely overstaffing low-performing locations and under-resourcecing winners, systematically destroying profitability.
Problem 4: Inconsistent Reporting & Decision-Making
Different locations report different metrics in different formats. Your stores use different accounting methods. One uses cash accounting, another accrual. One categorizes “supplies” differently than another.
When the CEO requests “profitability by location,” you spend hours standardizing definitions, recalculating, and reconciling. By then, the decision window has passed.
Result? Strategic decisions are made on incomplete or unreliable data, leading to poor allocation of capital, talent, and marketing resources.
Problem 5: Scalability Ceiling
Here’s the hard truth: manual consolidation doesn’t scale. You can barely handle 3 locations. At 5-7 locations, your finance person is drowning. At 10+ locations, manual processes completely break.
Many multi-location businesses hit this “growth ceiling” at 5-8 locations and can’t scale further without hiring full-time finance staff—a $60-100K annual expense that doesn’t generate revenue.
The Real Cost of Financial Data Chaos
Direct Costs
- Labor: 10-40 hours/month at $50/hour = $500-$2,000/month
- Software: Duplicate accounting software licenses for each location = $100-$500/month
- Errors: Manual data entry mistakes requiring correction = $1,000-$5,000/month (understated)
- Missed opportunities: Delayed visibility costing margin recovery = $5,000-$25,000/month
Total Monthly Cost: $6,500-$32,500
Annual Cost of Chaos: $78,000-$390,000
Indirect Costs
- Decision delays: Strategies implemented 6-8 weeks late lose compounding advantage
- Inconsistent execution: Locations operate with different rules, metrics, and priorities
- Talent constraints: Finance team overwhelmed with data consolidation, no capacity for analysis
- Growth paralysis: Can’t scale to new locations without major operational restructuring
- Investor/lender concerns: Inconsistent financial reporting raises red flags during fundraising or refinancing
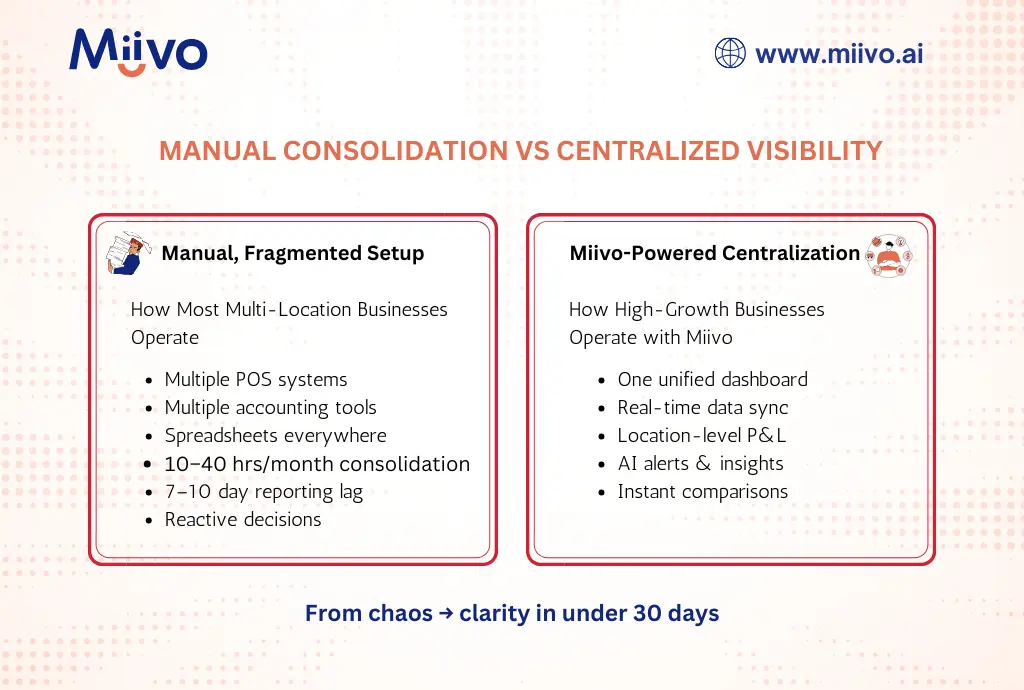
The Solution: Centralized Financial Visibility
What Centralized Visibility Looks Like
Imagine this: Every morning, you open a single dashboard and instantly see:
- Real-time sales data from all locations
- Profitability by location (with unit economics drill-down)
- Labor cost allocation by store
- Inventory position across all locations
- Cash position aggregated and by location
- Key metrics (margin %, traffic, AOV, labor cost %, shrink) with location-level comparisons
All data is current to yesterday, automatically consolidated, and pre-calculated. No spreadsheets. No manual work.
You notice Location 2 is trending negative on margin. You drill into the dashboard and see it’s due to labor costs spiking after a seasonal hire didn’t work out. You send a message to the Location 2 manager with recommendations. Problem solved before it metastasizes.
You compare Location 3’s profitability to Location 1 and notice Location 3 has higher shrink. You investigate and find an inventory tracking issue that’s been costing $2,000/month. Fixed in an afternoon.
This is centralized financial visibility in action and it’s transformable.
How Miivo Solves Multi-Location Chaos
Miivo is specifically designed for businesses like yours:
- One-Click Consolidation
-
- Connect all your POS systems, accounting software, bank accounts, and inventory systems
- Miivo automatically pulls data from each location in real-time
- Zero manual data entry required
- Location-Level Profitability Analysis
-
- See profit & loss by store, down to the SKU level
- Compare unit economics across locations (AOV, conversion rate, customer acquisition cost)
- Identify high-performers and under performers instantly
- Standardized Metrics
-
- All locations report using the same definitions and accounting methods
- Pre-built KPI dashboards adapted to your business model
- Industry benchmarks help you identify anomalies quickly
- Real-Time Alerts
-
- Flag when a location’s profitability drops below target
- Alert you to unusual spending patterns (e.g., Location 1 labor costs suddenly up 20%)
- Highlight opportunities (e.g., Location 3 has excess cash, Location 2 needs attention)
- Actionable Recommendations
-
- “Location 2’s profitability is trending negative due to [specific reason]. Here’s the action plan…”
- Automatic task generation for management team
- Clear implementation steps with expected outcomes
- Mobile Access
-
- Check financial health across all locations via WhatsApp or mobile app
- Get answers to questions like “What’s our cash position across all stores?” instantly
- Share real-time dashboards with location managers and lenders
Real-World Example: How a 5-Location Fitness Chain Got Visibility Back
The Situation:
Sarah owned 5 fitness studios across a metro area. Each had its own POS system, accounting setup, and management style. She spent 15+ hours every week consolidating data from all locations into a master spreadsheet. By the time she had the full picture, it was already 10 days old.
The Problem:
- Studio 3 was struggling profitability-wise, but Sarah couldn’t pinpoint why
- She didn’t know if it was too many staff members, low member acquisition, or high churn
- Marketing budget was allocated equally across all studios—clearly wrong, but she had no data to prove it
- She had no idea which classes were most profitable
- Expansion to a 6th studio felt impossible given how overwhelmed she already was
The Solution:
Sarah implemented Miivo and connected all 5 studios’ data sources. Within 48 hours:
Findings:
- Studio 3’s problem identified: 28% labor cost vs. 22% at other studios. Investigation revealed over-scheduling during off-peak hours.
- Marketing inefficiency discovered: Studio 1 had 40% higher member acquisition cost than Studio 4, despite same market. Different acquisition channels had vastly different efficiency.
- Class profitability analyzed: High-attendance classes (yoga, HIIT) had different per-member economics than niche classes. She could optimize scheduling accordingly.
- Cash position clarity: Studios 1 and 2 had excess cash; Studios 3 and 4 were tight. She could reallocate working capital more efficiently.
Results:
- Reduced weekly consolidation work from 15 hours to 1 hour
- Fixed Studio 3’s labor scheduling, recovering $3,000/month profitability
- Optimized marketing spend allocation by channel, improving member acquisition by 18%
- Expanded to 6th studio with confidence (had the systems and visibility to manage it)
- Promoted Studio 1 manager to regional operations (she had the data to identify the best performer)
MRR Impact: +$8,500 from operational improvements alone
How to Consolidate Your Financial Data: Implementation Roadmap
Step 1: Audit Your Current Data Sources (Week 1)
Document all systems generating financial data:
- POS Systems: Square, Toast, Lightspeed, custom?
- Accounting: QuickBooks Online, Xero, custom?
- Payments: Stripe, Square, PayPal?
- Inventory: Dedicated system or within accounting software?
- Banking: Single master account or separate accounts per location?
Deliverable: List of 10-15 data sources and their current integration status
Step 2: Choose Your Consolidation Platform (Week 2)
Evaluate options:
- Dedicated multi-location BI tools: Tableau, Power BI, Looker (expensive, complex)
- Accounting software add-ons: Spotlight Reporting, Fathom (limited scope, still requires integration work)
- AI-powered SME advisors: Miivo (consolidation + insights + automation)
Key Criteria:
- Supports all your data sources
- Real-time data refresh (not daily or monthly)
- Location-level drill-down capability
- Pre-built SME/retail dashboards (don’t want to build from scratch)
- Mobile and web access
- Customer support for implementation
Step 3: Implementation (Weeks 3-4)
- Connect data sources: Authorize each system, set up API connections or direct integrations
- Configure location hierarchies: Define how locations map in the platform
- Standardize metrics: Ensure consistent definitions across locations
- Build dashboards: Customize views for CEO, location managers, finance team
Step 4: Train Your Team (Week 4)
- Finance team on data governance and updates
- Location managers on accessing location-level performance data
- Leadership on interpreting dashboards and making decisions
Step 5: Optimize & Scale (Ongoing)
- Review dashboards weekly to validate accuracy
- Adjust metrics based on what matters most
- Add new locations easily (no rebuilding required)
Comparing Consolidation Approaches
| Approach | Time to Consolidate | Data Currency | Cost | Scalability | Insights |
| Manual Spreadsheets | 7-10 days | Stale | $500-$2,000/mo labor | ✗ Breaks at 5+ locations | None—just data |
| BI Tools (Tableau, Power BI) | 2-3 days | 1 day lag | $500-$3,000/mo + implementation | ✓ Scales but requires expertise | Limited—you build queries |
| Accounting Add-ons | 3-5 days | Overnight | $100-$500/mo | ✓ Limited to accounting data | Reporting only |
| Miivo AI Advisor | Real-time | Current to yesterday | $399/mo | ✓ Scales effortlessly | Actionable insights + recommendations |
The ROI of Consolidation
Conservative Estimate (3 Locations, $3M Annual Revenue)
Current State Costs:
- Labor: $750/mo = $9,000/year
- Duplicate software: $200/mo = $2,400/year
- Missed opportunities (conservative): $5,000/mo = $60,000/year
- Total annual cost: $71,400
With Consolidation (Miivo at $399/mo):
- Labor: $0 (automated) = $0
- Software: $399/mo = $4,788/year
- Operational improvements (margin recovery, optimization): $2,000/mo = $24,000/year
- Net savings: ~$42,612/year
ROI: 1,177% annual return (saves ~$42,600 vs. costs $4,800)
Payback period: Less than 2 weeks
Realistic Scenario (5 Locations, $10M Annual Revenue)
Current State Costs:
- Labor: $2,000/mo = $24,000/year
- Duplicate software: $500/mo = $6,000/year
- Missed opportunities (conservative): $8,000/mo = $96,000/year
- Total annual cost: $126,000
With Consolidation:
- Labor: $0 (automated) = $0
- Software: $399/mo = $4,788/year
- Operational improvements: $4,000/mo = $48,000/year
- Net savings: ~$121,212/year
ROI: 2,533% annual return
Payback period: Less than 1 week
Why Multi-Location Businesses Choose Miivo
Miivo goes beyond consolidation—it provides strategic insight:
- Automated Consolidation
No more manual spreadsheet work. Connect once, get real-time consolidated view forever. - Location-Level Intelligence
Drill down to understand what’s driving profitability (or losses) at each location. - AI-Powered Recommendations
“Your Boston location is trending negative due to labor cost spike. Here’s the fix…” - Location Manager Empowerment
Managers see their location’s metrics compared to peers, driving healthy competition and accountability. - Scaling Made Easy
Add new locations to your dashboard in minutes. Same consolidation magic applies immediately. - Mobile & Chat-Based
Check on your business via WhatsApp or mobile app anytime, anywhere.
Checklist: Is Your Multi-Location Business Ready for Consolidation?
☐ You spend >5 hours/week consolidating financial data across locations
☐ Your financial reports are 5+ days behind current operations
☐ You don’t have location-level profitability visibility
☐ Different locations report using different metrics or accounting methods
☐ You have 3+ locations and plan to expand further
☐ Growth is being constrained by inability to manage multiple locations effectively
☐ You want to empower location managers with performance data
Score: If you checked 4+, consolidation should be your immediate priority.
The Path Forward: Taking Action This Week
Day 1: List all your data sources and current pain points
Day 2: Schedule a demo with Miivo to explore your specific use case
Day 3: Evaluate the implementation timeline and cost
Day 4: Make the decision and begin implementation
Week 2: Connected systems and initial dashboard setup
Week 3: Train your team
Week 4: Start making data-driven decisions across all locations
Most multi-location businesses see ROI within the first month.
Conclusion: From Chaos to Clarity
Financial data chaos isn’t just annoying—it costs you tens of thousands of dollars annually in lost labor, missed opportunities, and suboptimal decisions.
The solution isn’t hiring more finance staff. It’s implementing modern financial consolidation and intelligence tools that automatically pull your data together, identify insights, and recommend actions.
With Miivo, you can go from drowning in spreadsheets to having real-time, location-level financial visibility in days. You’ll spend less time consolidating and more time strategizing. You’ll make faster, better-informed decisions. And you’ll unlock significant profitability improvements and scalability.
The question isn’t whether you can afford to consolidate your financial data. It’s whether you can afford not to.